The main cause of subgrade diseases is that the road surface is paved when the foundation has not yet completed consolidation and stabilization, which leads to excessive post-construction settlement of the subgrade and further causes pavement diseases.Monitoring is carried out starting from the subgrade construction stage. By observing the settlement rate of the subgrade in real time, it is determined whether the subgrade has achieved consolidation and stabilization, thus identifying the appropriate timing for pavement paving and providing guidance for the road construction schedule.After the completion of construction, the monitoring equipment continues to function during the operation period, ensuring the safe operation of the road.
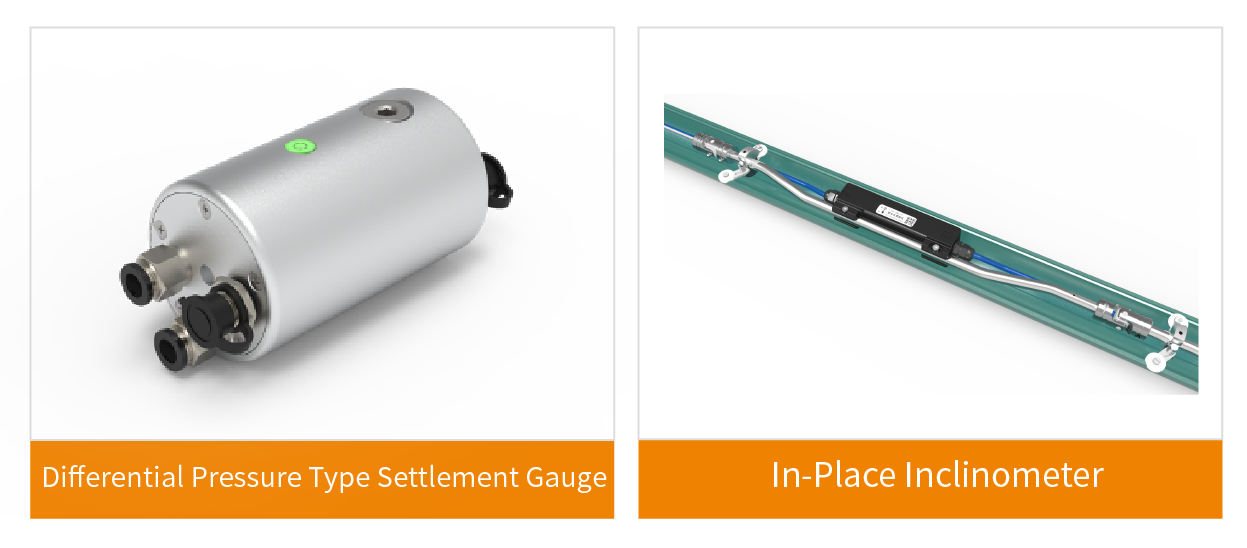

▋A Subgrade Monitoring Project
An airport is constructed on a lake in Hubei Province, where the geological conditions are harsh. However, the airport construction has high requirements for the engineering performance of the foundation, especially strict requirements for differential settlement. Therefore, it is necessary to treat the soft soil foundation.
The airport foundation treatment adopts the method of rock filling for silt squeezing + surcharge preloading + drainage board consolidation. To test the effect of foundation treatment, automated subgrade monitoring is carried out on the airport's aircraft runway.

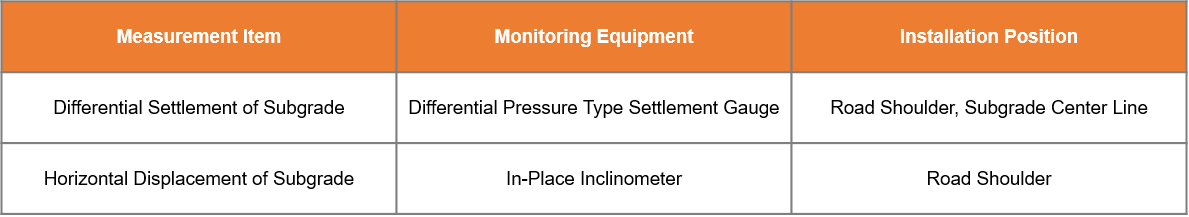
From March 25, 2019 to April 10, 2019, the cumulative variations of CD1 and CD2 are 28.01 mm and 52.16 mm respectively, and the daily variations are 1.87 mm and 3.48 mm respectively. The settlement deformation curve shows a linear pattern, and the deformation tends to develop stably.
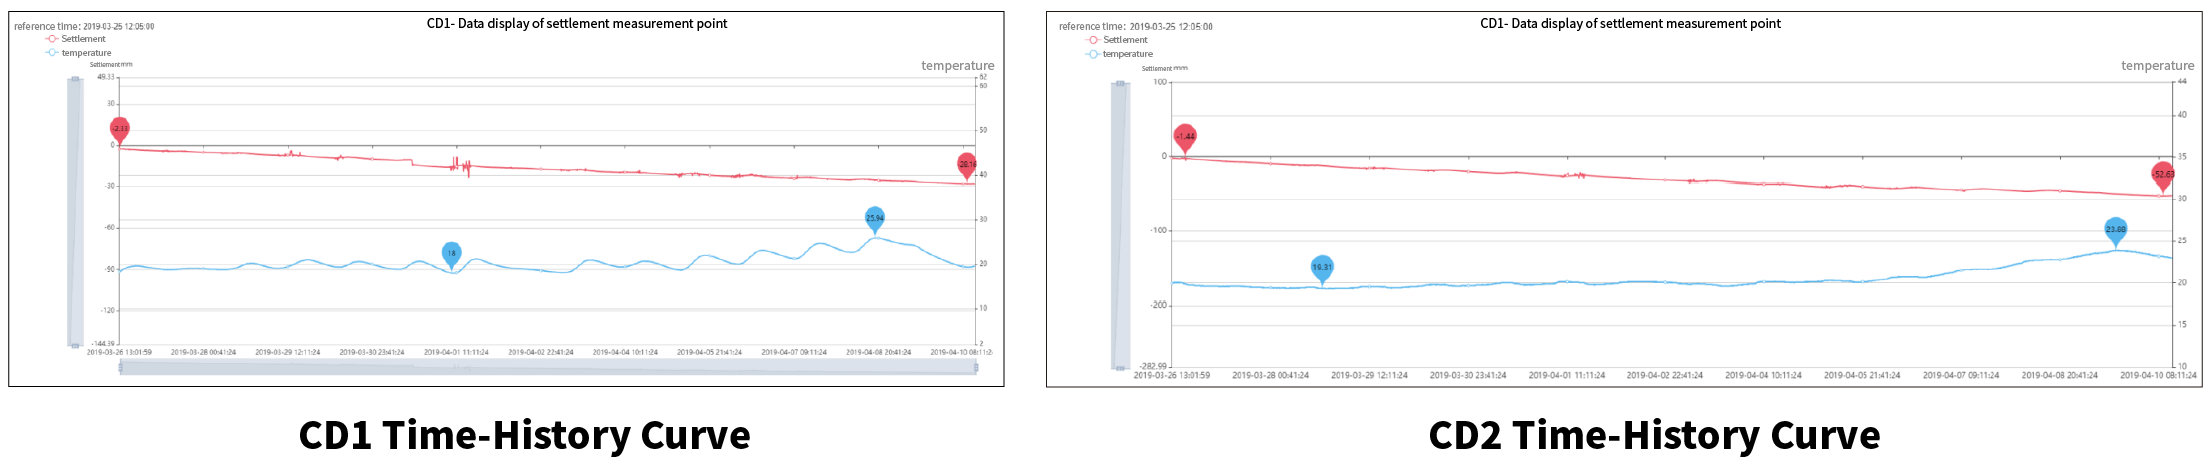
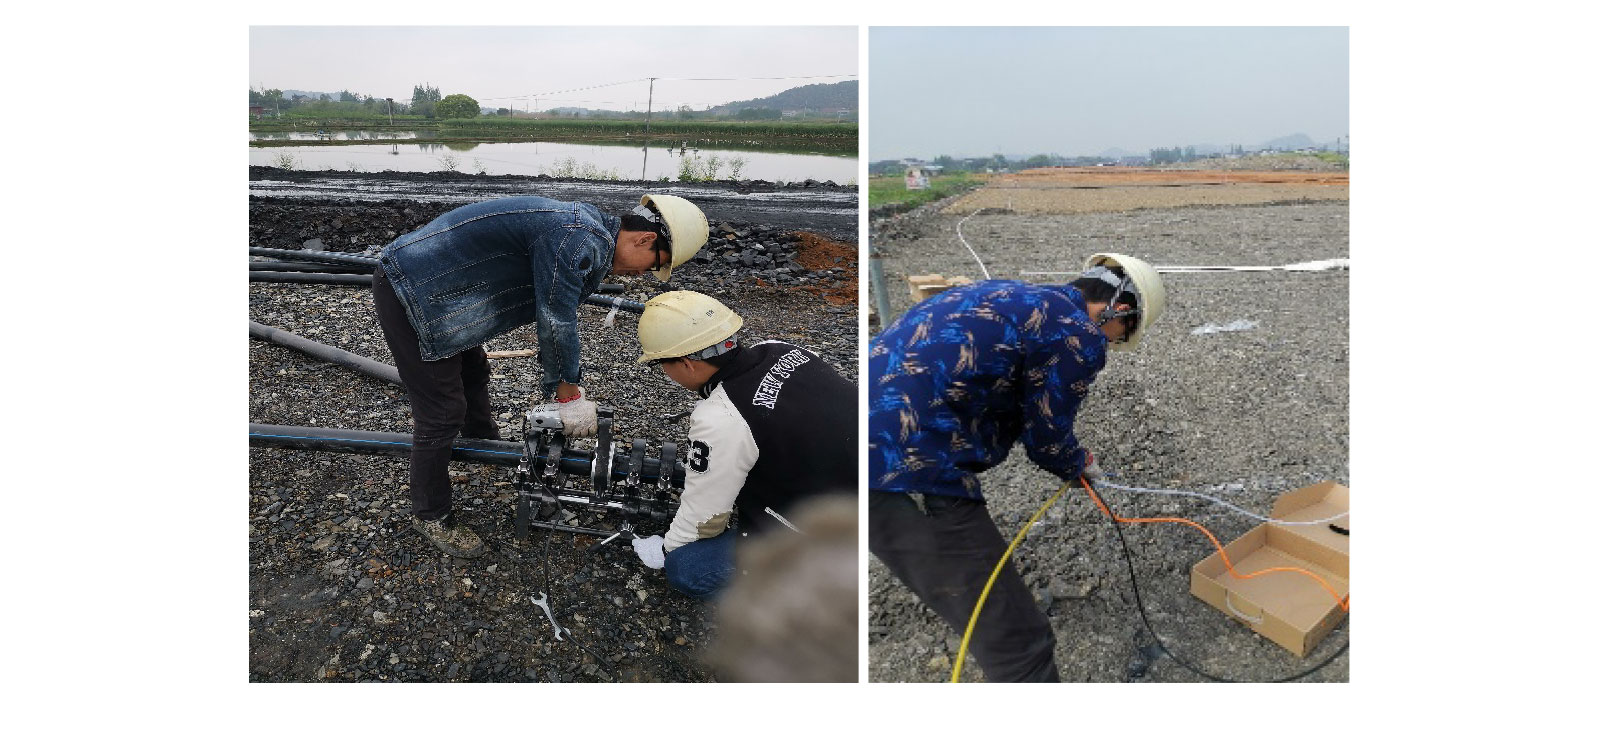
▋B Subgrade Monitoring Project
This section is a soft foundation section with a subgrade length of 2.457 km. The section types include high fill bridge head sections, floating pile sections, long-short pile gradual transition sections, and riverfront sections. A total of 17 monitoring cross-sections and 51 monitoring points have been deployed.
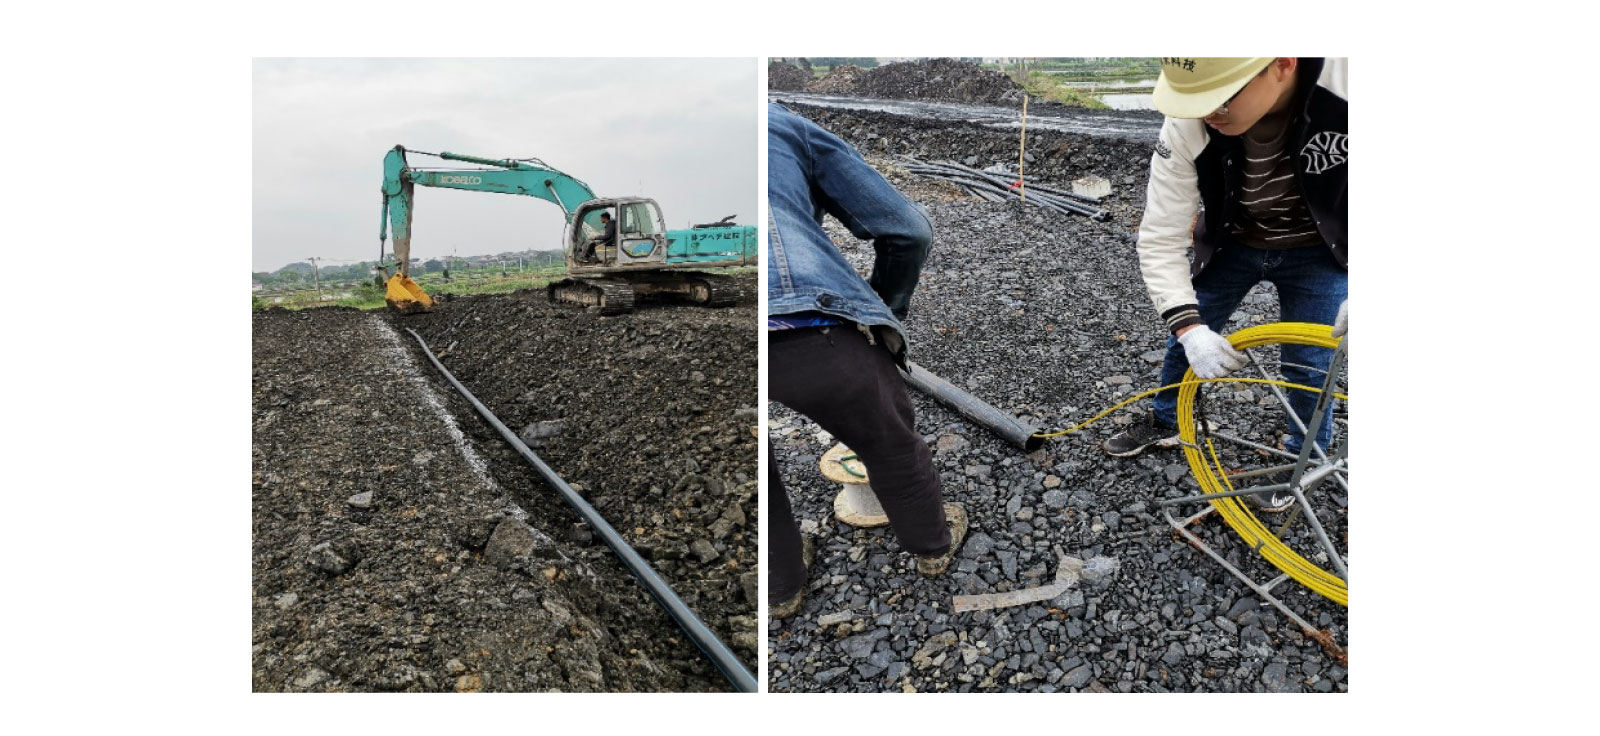
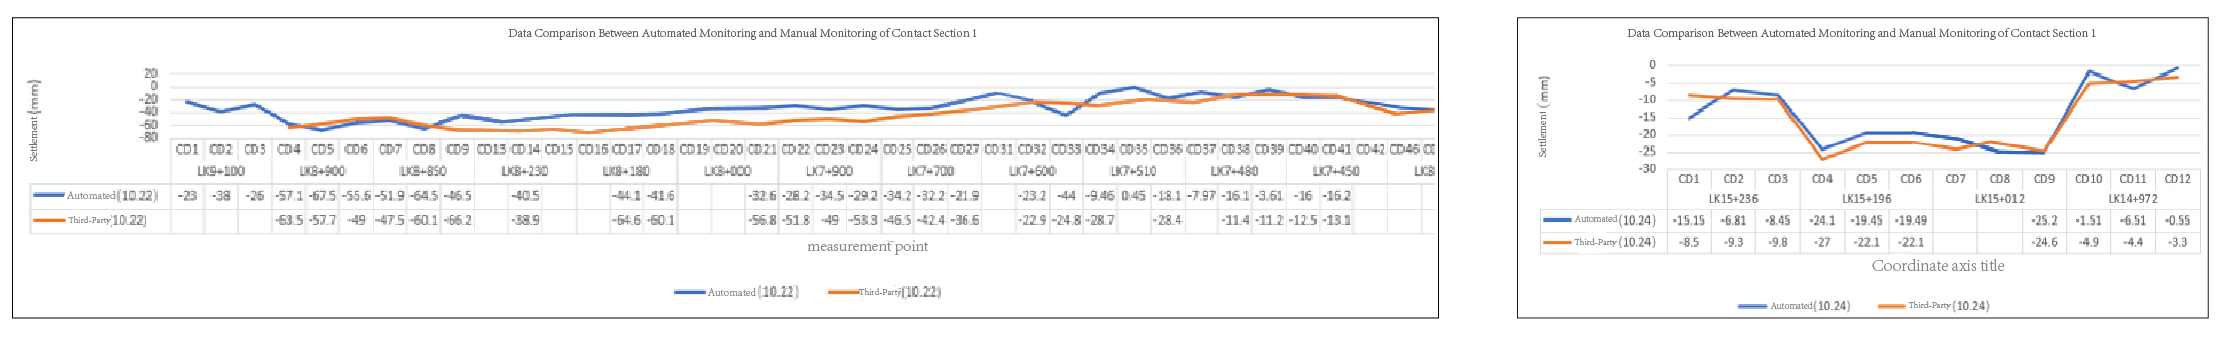
Based on the overall analysis of monitoring data, a comparison between automated monitoring and manual monitoring data shows that the data trends are basically consistent.
Business Consulting: +86 21 65108390 Service: +86 400 0716 158
11th Floor, Section E, No. 1515 Zhongshan North 2nd Road, Hongkou District, Shanghai, China(Tongji Hongkou Green Technology IndustrialPark)
Click to enter:TOEHOLD Sensing Cloud Structural Health Monitoring Management Platform

WeChat Account

Video Channel

Toehold SHM
© Toehold Engineering Technology Co., Ltd.Shanghai

Back to Top

400-0716-158


Follow Toehold